Many developers think that having a critical bug in their code is the worst thing that can happen. Well, there is something much worse than that: Having a critical bug in your code and not knowing about it!
To make sure I get notified about critical bugs as soon as possible, I started looking for ways to find anomalies in my data. I quickly found that information about these subjects tend to get very complicated, and involve a lot of ad-hoc tools and dependencies.
I'm not a statistician and not a data scientist, I'm just a developer. Before I introduce dependencies into my system I make sure I really can't do without them. So, using some high school level statistics and a fair knowledge of SQL, I implemented a simple anomaly detection system that works.

Photo by Ricardo Gomez Angel
Table of Contents
Interactive Course
Interactive Editor
Detecting Anomalies
Anomaly in a data series is a significant deviation from some reasonable value. Looking at this series of numbers for example, which number stands out?
2, 3, 5, 2, 3, 12, 5, 3, 4
The number that stands out in this series is 12.
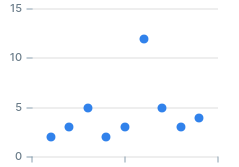
This is intuitive to a human, but computer programs don't have intuition...
To find the anomaly in the series we first need to define what a reasonable value is, and then define how far away from this value we consider a significant deviation. A good place to start looking for a reasonable value is the mean:
SELECT avg(n)
FROM unnest(array[2, 3, 5, 2, 3, 12, 5, 3, 4]) AS n;

       avg
────────────────────
4.3333333333333333
The mean is ~4.33.
Next, we need to define the deviation. Let's use Standard Deviation:
SELECT stddev(n)
FROM unnest(array[2, 3, 5, 2, 3, 12, 5, 3, 4]) AS n;

      stddev
────────────────────
3.0822070014844882
Standard deviation is the square root of the variance, which is the average squared distance from the mean. In this case it's 3.08.
Now that we've defined a "reasonable" value and a deviation, we can define a range of acceptable values:
SELECT
   avg(n) - stddev(n) AS lower_bound,
   avg(n) + stddev(n) AS upper_bound
FROM
   unnest(array[2, 3, 5, 2, 3, 12, 5, 3, 4]) AS n;

    lower_bound    │     upper_bound
───────────────────┼────────────────────
1.2511263318488451 │ 7.4155403348178215
The range we defined is one standard deviation from the mean. Any value outside this range is considered an anomaly:
WITH series AS (
   SELECT *
   FROM unnest(array[2, 3, 5, 2, 3, 12, 5, 3, 4]) AS n
),
bounds AS (
   SELECT
       avg(n) - stddev(n) AS lower_bound,
       avg(n) + stddev(n) AS upper_bound
   FROM
       series
)
SELECT
   n,
   n NOT BETWEEN lower_bound AND upper_bound AS is_anomaly
FROM
   series,
   bounds;

n  │ is_anomaly
───┼────────────
 2 │ f
 3 │ f
 5 │ f
 2 │ f
 3 │ f
12 │ t
 5 │ f
 3 │ f
 4 │ f
Using the query we found that the value 12 is outside the range of acceptable values, and identified it as an anomaly.
Understanding Z-Score
Another way to represent a range of acceptable values is using a z-score. z-score, or Standard Score, is the number of standard deviations from the mean. In the previous section, our acceptable range was one standard deviation from the mean, or in other words, a z-score in the range ±1:
WITH series AS (
   SELECT *
   FROM unnest(array[2, 3, 5, 2, 3, 12, 5, 3, 4]) AS n
),
stats AS (
   SELECT
       avg(n) series_mean,
       stddev(n) as series_stddev
   FROM
       series
)
SELECT
   n,
   (n - series_mean) / series_stddev as zscore
FROM
   series,
   stats;

n  │         zscore
───┼─────────────────────────
 2 │ -0.75703329861022517346
 3 │ -0.43259045634870009448
 5 │  0.21629522817435006346
 2 │ -0.75703329861022517346
 3 │ -0.43259045634870009448
12 │      2.4873951240050256
 5 │  0.21629522817435006346
 3 │ -0.43259045634870009448
 4 │ -0.10814761408717501551
Like before, we can detect anomalies by searching for values which are outside the acceptable range using the z-score:
WITH series AS (
   SELECT *
   FROM unnest(array[2, 3, 5, 2, 3, 12, 5, 3, 4]) AS n
),
stats AS (
   SELECT
       avg(n) series_avg,
       stddev(n) as series_stddev
   FROM
       series
),
zscores AS (
   SELECT
       n,
       (n - series_avg) / series_stddev AS zscore
   FROM
       series,
       stats
)
SELECT
   *,
   zscore NOT BETWEEN -1 AND 1 AS is_anomaly
FROM
   zscores;

n  │         zscore          │ is_anomaly
───┼─────────────────────────┼────────────
 2 │ -0.75703329861022517346 │ f
 3 │ -0.43259045634870009448 │ f
 5 │  0.21629522817435006346 │ f
 2 │ -0.75703329861022517346 │ f
 3 │ -0.43259045634870009448 │ f
12 │      2.4873951240050256 │ t
 5 │  0.21629522817435006346 │ f
 3 │ -0.43259045634870009448 │ f
 4 │ -0.10814761408717501551 │ f
Using z-score, we also identified 12 as an anomaly in this series.
Optimizing Z-Score
So far we used one standard deviation from the mean, or a z-score of ±1 to identify anomalies. Changing the z-score threshold can affect our results. For example, let's see what anomalies we identify when the z-score is greater than 0.5 and when it's greater than 3:
WITH series AS (
   SELECT *
   FROM unnest(array[2, 3, 5, 2, 3, 12, 5, 3, 4]) AS n
),
stats AS (
   SELECT
       avg(n) series_avg,
       stddev(n) as series_stddev
   FROM
       series
),
zscores AS (
   SELECT
       n,
       (n - series_avg) / series_stddev AS zscore
   FROM
       series,
       stats
)
SELECT
   *,
   zscore NOT BETWEEN -0.5 AND 0.5 AS is_anomaly_0_5,
   zscore NOT BETWEEN -1 AND 1 AS is_anomaly_1,
   zscore NOT BETWEEN -3 AND 3 AS is_anomaly_3
FROM
   zscores;

n  │         zscore          │ is_anomaly_0_5 │ is_anomaly_1 │ is_anomaly_3
───┼─────────────────────────┼────────────────┼──────────────┼──────────────
 2 │ -0.75703329861022517346 │ t              │ f            │ f
 3 │ -0.43259045634870009448 │ f              │ f            │ f
 5 │  0.21629522817435006346 │ f              │ f            │ f
 2 │ -0.75703329861022517346 │ t              │ f            │ f
 3 │ -0.43259045634870009448 │ f              │ f            │ f
12 │      2.4873951240050256 │ t              │ t            │ f
 5 │  0.21629522817435006346 │ f              │ f            │ f
 3 │ -0.43259045634870009448 │ f              │ f            │ f
 4 │ -0.10814761408717501551 │ f              │ f            │ f
Let's see what we got:
- When we decreased the z-score threshold to 0.5, we identified the value 2 as an anomaly in addition to the value 12.
- When we increased the z-score threshold to 3 we did not identify any anomaly.
The quality of our results are directly related to the parameters we set for the query. Later we'll see how using backtesting can help us identify ideal values.
Analyzing a Server Log
Application servers such as nginx, Apache and IIS write a lot of useful information to access logs. The data in these logs can be extremely useful in identifying anomalies.
We are going to analyze logs of a web application, so the data we are most interested in is the timestamp and the status code of every response from the server. To illustrate the type of insight we can draw from just this data:
- A sudden increase in 500 status code: You may have a problem in the server. Did you just push a new version? Is there an external service you're using that started failing in unexpected ways?
- A sudden increase in 400 status code: You may have a problem in the client. Did you change some validation logic and forgot to update the client? Did you make a change and forgot to handle backward compatibility?
- A sudden increase in 404 status code: You may have an SEO problem. Did you move some pages and forgot to set up redirects? Is there some script kiddy running a scan on your site?
- A sudden increase in 200 status code: You either have some significant legit traffic coming in, or you are under a DOS attack. Either way, you probably want to check where it's coming from.
Preparing the Data
Parsing and processing logs is outside the scope of this article, so let's assume we did that and we have a table that looks like this:
CREATE TABLE server_log_summary AS (
   period timestamptz,
   status_code int,
   entries int
);
The table stores the number of entries for each status code at a given period. For example, our table stores how many responses returned each status code every minute:
db=# SELECT * FROM server_log_summary ORDER BY period DESC LIMIT 10;

        period         │ status_code │ entries
───────────────────────┼─────────────┼─────────
2020-08-01 18:00:00+00 │         200 │    4084
2020-08-01 18:00:00+00 │         404 │       0
2020-08-01 18:00:00+00 │         400 │      24
2020-08-01 18:00:00+00 │         500 │       0
2020-08-01 17:59:00+00 │         400 │      12
2020-08-01 17:59:00+00 │         200 │    3927
2020-08-01 17:59:00+00 │         500 │       0
2020-08-01 17:59:00+00 │         404 │       0
2020-08-01 17:58:00+00 │         400 │       2
2020-08-01 17:58:00+00 │         200 │    3850
Note that the table has a row for every minute, even if the status code was never returned in that minute. Given a table of statuses, it's very tempting to do something like this:
-- Wrong!
SELECT
   date_trunc('minute', timestamp) AS period,
   status_code,
   count(*) AS entries
FROM
   server_log
GROUP BY
   period,
   status_code;
This is a common mistake and it can leave you with gaps in the data. Zero is a value, and it holds a significant meaning. A better approach is to create an "axis", and join to it:
-- Correct!
WITH axis AS (
   SELECT
       status_code,
       generate_series(
           date_trunc('minute', now()),
           date_trunc('minute', now() - interval '1 hour'),
           interval '1 minute' * -1
       ) AS period
   FROM (
       VALUES (200), (400), (404), (500)
   ) AS t(status_code)
)
SELECT
   a.period,
   a.status_code,
   count(*) AS entries
FROM
   axis a
   LEFT JOIN server_log l ON (
       date_trunc('minute', l.timestamp) = a.period
       AND l.status_code = a.status_code
   )
GROUP BY
   period,
   status_code;
First we generate an axis using a cartesian join between the status codes we want to track, and the times we want to monitor. To generate the axis we used two nice features of PostgreSQL:
generate_series: function that generates a range of values.VALUESlist: special clause that can generate "constant tables", as the documentation calls it. You might be familiar with theVALUESclause fromINSERTstatements. In the old days, to generate data we had to use a bunch ofSELECT ... UNION ALL... usingVALUESis much nicer.
After generating the axis, we left join the actual data into it to get a complete series for each status code. The resulting data has no gaps, and is ready for analysis.
Getting a Sense of the Data
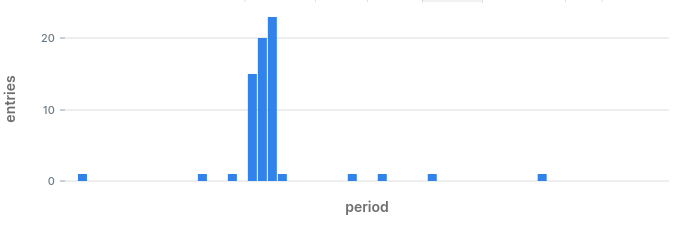
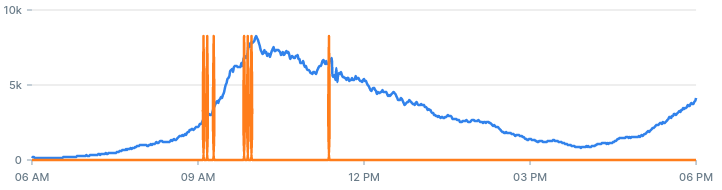
To get a sense of the data, let's draw a stacked bar chart by status:
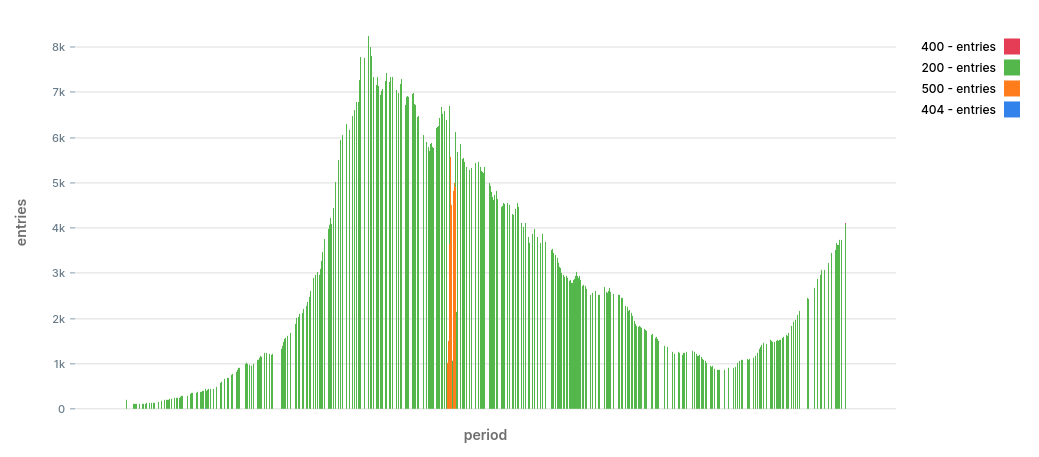
The chart shows a period of 12 hours. It looks like we have a nice trend with two peaks at around 09:30 and again at 18:00.
We also spot right away that at ~11:30 there was a significant increase in 500 errors. The burst died down after around 10 minutes. This is the type of anomalies we want to identify early on.
It's entirely possible that there were other problems during that time, we just can't spot them with a naked eye.
Identifying Anomalies
In anomaly detection systems, we usually want to identify if we have an anomaly right now, and send an alert.
To identify if the last datapoint is an anomaly, we start by calculating the mean and standard deviation for each status code in the past hour:
db=# WITH stats AS (
   SELECT
       status_code,
       (MAX(ARRAY[EXTRACT('epoch' FROM period), entries]))[2] AS last_value,
       AVG(entries) AS mean_entries,
       STDDEV(entries) AS stddev_entries
   FROM
       server_log_summary
   WHERE
       -- In the demo data use:
       -- period > '2020-08-01 17:00 UTC'::timestamptz
       period > now() - interval '1 hour'
   GROUP BY
       status_code
)
SELECT * FROM stats;

status_code │ last_value │      mean_entries      │     stddev_entries
────────────┼────────────┼────────────────────────┼────────────────────────
        404 │          0 │ 0.13333333333333333333 │ 0.34280333180088158345
        500 │          0 │ 0.15000000000000000000 │ 0.36008473579027553993
        200 │       4084 │  2779.1000000000000000 │       689.219644702665
        400 │         24 │ 0.73333333333333333333 │     3.4388935285299212
To get the last value in a GROUP BY in addition to the mean and standard deviation we used a little array trick.
Next, we calculate the z-score for the last value for each status code:
db=# WITH stats AS (
   SELECT
       status_code,
       (MAX(ARRAY[EXTRACT('epoch' FROM period), entries]))[2] AS last_value,
       AVG(entries) AS mean_entries,
       STDDEV(entries) AS stddev_entries
   FROM
       server_log_summary
   WHERE
       -- In the demo data use:
       -- period > '2020-08-01 17:00 UTC'::timestamptz
       period > now() - interval '1 hour'
   GROUP BY
       status_code
)
SELECT
   *,
   (last_value - mean_entries) / NULLIF(stddev_entries::float, 0) as zscore
FROM
   stats;

status_code │ last_value │ mean_entries │ stddev_entries │  zscore
────────────┼────────────┼──────────────┼────────────────┼────────
        404 │          0 │ 0.133        │ 0.3428         │ -0.388
        500 │          0 │ 0.150        │ 0.3600         │ -0.416
        200 │       4084 │ 2779.100     │ 689.2196       │  1.893
        400 │         24 │ 0.733        │ 3.4388         │  6.765
We calculated the z-score by finding the number of standard deviations between the last value and the mean. To avoid a "division by zero" error we transform the denominator to NULL if it's zero.
Looking at the z-scores we got, we can spot that status code 400 got a very high z-score of 6. In the past minute we returned a 400 status code 24 times, which is significantly higher than the average of 0.73 in the past hour.
Let's take a look at the raw data:
SELECT *
FROM server_log_summary
WHERE status_code = 400
ORDER BY period DESC
LIMIT 20;

        period         │ status_code │ entries
───────────────────────┼─────────────┼─────────
2020-08-01 18:00:00+00 │         400 │      24
2020-08-01 17:59:00+00 │         400 │      12
2020-08-01 17:58:00+00 │         400 │       2
2020-08-01 17:57:00+00 │         400 │       0
2020-08-01 17:56:00+00 │         400 │       1
2020-08-01 17:55:00+00 │         400 │       0
2020-08-01 17:54:00+00 │         400 │       0
2020-08-01 17:53:00+00 │         400 │       0
2020-08-01 17:52:00+00 │         400 │       0
2020-08-01 17:51:00+00 │         400 │       0
2020-08-01 17:50:00+00 │         400 │       0
2020-08-01 17:49:00+00 │         400 │       0
2020-08-01 17:48:00+00 │         400 │       0
2020-08-01 17:47:00+00 │         400 │       0
2020-08-01 17:46:00+00 │         400 │       0
2020-08-01 17:45:00+00 │         400 │       0
2020-08-01 17:44:00+00 │         400 │       0
2020-08-01 17:43:00+00 │         400 │       0
2020-08-01 17:42:00+00 │         400 │       0
2020-08-01 17:41:00+00 │         400 │       0
It does look like in the last couple of minutes we are getting more errors than expected.
What our naked eye missed in the chart and in the raw data, was found by the query, and was classified as an anomaly. We are off to a great start!
Backtesting
In the previous section we identified an anomaly. We found an increase in 400 status code because the z-score was 6. But how do we set the threshold for the z-score? Is a z-score of 3 an anomaly? What about 2, or 1?
To find thresholds that fit our needs, we can run simulations on past data with different values, and evaluate the results. This is often called backtesting.
Finding Past Anomalies
The first thing we need to do is to calculate the mean and the standard deviation for each status code up until every row, just as if it’s the current value. This is a classic job for a window function:
WITH calculations_over_window AS (
   SELECT
      status_code,
      period,
      entries,
      AVG(entries) OVER status_window as mean_entries,
      STDDEV(entries) OVER status_window as stddev_entries
   FROM
      server_log_summary
   WINDOW status_window AS (
      PARTITION BY status_code
      ORDER BY period
      ROWS BETWEEN 60 PRECEDING AND CURRENT ROW
   )
)
SELECT *
FROM calculations_over_window
ORDER BY period DESC
LIMIT 20;

status_code │         period         │ entries │      mean_entries      │     stddev_entries
────────────┼────────────────────────┼─────────┼────────────────────────┼────────────────────────
        200 │ 2020-08-01 18:00:00+00 │    4084 │  2759.9672131147540984 │       699.597407256800
        400 │ 2020-08-01 18:00:00+00 │      24 │ 0.72131147540983606557 │     3.4114080550460080
        404 │ 2020-08-01 18:00:00+00 │       0 │ 0.13114754098360655738 │ 0.34036303344446665347
        500 │ 2020-08-01 18:00:00+00 │       0 │ 0.14754098360655737705 │ 0.35758754516763638735
        500 │ 2020-08-01 17:59:00+00 │       0 │ 0.16393442622950819672 │ 0.37328844382740000274
        400 │ 2020-08-01 17:59:00+00 │      12 │ 0.32786885245901639344 │     1.5676023249473471
        200 │ 2020-08-01 17:59:00+00 │    3927 │  2718.6721311475409836 │       694.466863171826
        404 │ 2020-08-01 17:59:00+00 │       0 │ 0.13114754098360655738 │ 0.34036303344446665347
        500 │ 2020-08-01 17:58:00+00 │       0 │ 0.16393442622950819672 │ 0.37328844382740000274
        404 │ 2020-08-01 17:58:00+00 │       0 │ 0.13114754098360655738 │ 0.34036303344446665347
        200 │ 2020-08-01 17:58:00+00 │    3850 │  2680.4754098360655738 │       690.967283512936
        400 │ 2020-08-01 17:58:00+00 │       2 │ 0.13114754098360655738 │ 0.38623869286861001780
        404 │ 2020-08-01 17:57:00+00 │       0 │ 0.13114754098360655738 │ 0.34036303344446665347
        400 │ 2020-08-01 17:57:00+00 │       0 │ 0.09836065573770491803 │ 0.30027309973793774423
        500 │ 2020-08-01 17:57:00+00 │       1 │ 0.16393442622950819672 │ 0.37328844382740000274
        200 │ 2020-08-01 17:57:00+00 │    3702 │  2643.0327868852459016 │       688.414796645480
        200 │ 2020-08-01 17:56:00+00 │    3739 │  2607.5081967213114754 │       688.769908918569
        404 │ 2020-08-01 17:56:00+00 │       0 │ 0.14754098360655737705 │ 0.35758754516763638735
        400 │ 2020-08-01 17:56:00+00 │       1 │ 0.11475409836065573770 │ 0.32137001808599097120
        500 │ 2020-08-01 17:56:00+00 │       0 │ 0.14754098360655737705 │ 0.35758754516763638735
To calculate the mean and standard deviation over a sliding window of 60 minutes, we use a window function. To avoid having to repeat the WINDOW clause for every aggregate, we define a named window called "status_window". This is another nice feature of PostgreSQL.
In the results we can now see that for every entry, we have the mean and standard deviation of the previous 60 rows. This is similar to the calculation we did in the previous section, only this time we do it for every row.
Now we can calculate the z-score for every row:
WITH calculations_over_window AS (
   SELECT
      status_code,
      period,
      entries,
      AVG(entries) OVER status_window as mean_entries,
      STDDEV(entries) OVER status_window as stddev_entries
   FROM
      server_log_summary
   WINDOW status_window AS (
      PARTITION BY status_code
      ORDER BY period
      ROWS BETWEEN 60 PRECEDING AND CURRENT ROW
   )
),

with_zscore AS (
   SELECT
       *,
       (entries - mean_entries) / NULLIF(stddev_entries::float, 0) as zscore
   FROM
       calculations_over_window
)

SELECT
   status_code,
   period,
   zscore
FROM
   with_zscore
ORDER BY
   period DESC
LIMIT
   20;

status_code │         period         │        zscore
────────────┼────────────────────────┼──────────────────────
        200 │ 2020-08-01 18:00:00+00 │   1.8925638848161648
        400 │ 2020-08-01 18:00:00+00 │    6.823777205473068
        404 │ 2020-08-01 18:00:00+00 │ -0.38531664163524526
        500 │ 2020-08-01 18:00:00+00 │ -0.41260101365496504
        500 │ 2020-08-01 17:59:00+00 │  -0.4391628750910588
        400 │ 2020-08-01 17:59:00+00 │    7.445849602151508
        200 │ 2020-08-01 17:59:00+00 │   1.7399359608515874
        404 │ 2020-08-01 17:59:00+00 │ -0.38531664163524526
        500 │ 2020-08-01 17:58:00+00 │  -0.4391628750910588
        404 │ 2020-08-01 17:58:00+00 │ -0.38531664163524526
        200 │ 2020-08-01 17:58:00+00 │   1.6925903990967166
        400 │ 2020-08-01 17:58:00+00 │    4.838594613958412
        404 │ 2020-08-01 17:57:00+00 │ -0.38531664163524526
        400 │ 2020-08-01 17:57:00+00 │ -0.32757065425956844
        500 │ 2020-08-01 17:57:00+00 │      2.2397306629644
        200 │ 2020-08-01 17:57:00+00 │   1.5382691050147506
        200 │ 2020-08-01 17:56:00+00 │   1.6427718293547886
        404 │ 2020-08-01 17:56:00+00 │ -0.41260101365496504
        400 │ 2020-08-01 17:56:00+00 │     2.75460015502278
        500 │ 2020-08-01 17:56:00+00 │ -0.41260101365496504
We now have z-scores for every row, and we can try to identify anomalies:
WITH calculations_over_window AS (
   SELECT
       status_code,
       period,
       entries,
       AVG(entries) OVER status_window as mean_entries,
       STDDEV(entries) OVER status_window as stddev_entries
   FROM
       server_log_summary
   WINDOW status_window AS (
       PARTITION BY status_code
       ORDER BY period
       ROWS BETWEEN 60 PRECEDING AND CURRENT ROW
   )
),

with_zscore AS (
   SELECT
       *,
       (entries - mean_entries) / NULLIF(stddev_entries::float, 0) as zscore
   FROM
       calculations_over_window
),

with_alert AS (

   SELECT
       *,
       zscore > 3 AS alert
   FROM
       with_zscore
)

SELECT
   status_code,
   period,
   entries,
   zscore,
   alert
FROM
   with_alert
WHERE
   alert
ORDER BY
   period DESC
LIMIT
   20;

status_code │         period         │ entries │       zscore       │ alert
────────────┼────────────────────────┼─────────┼────────────────────┼───────
        400 │ 2020-08-01 18:00:00+00 │      24 │  6.823777205473068 │ t
        400 │ 2020-08-01 17:59:00+00 │      12 │  7.445849602151508 │ t
        400 │ 2020-08-01 17:58:00+00 │       2 │  4.838594613958412 │ t
        500 │ 2020-08-01 17:29:00+00 │       1 │ 3.0027309973793774 │ t
        500 │ 2020-08-01 17:20:00+00 │       1 │ 3.3190952747131184 │ t
        500 │ 2020-08-01 17:18:00+00 │       1 │ 3.7438474117708043 │ t
        500 │ 2020-08-01 17:13:00+00 │       1 │ 3.7438474117708043 │ t
        500 │ 2020-08-01 17:09:00+00 │       1 │  4.360778994930029 │ t
        500 │ 2020-08-01 16:59:00+00 │       1 │ 3.7438474117708043 │ t
        400 │ 2020-08-01 16:29:00+00 │       1 │ 3.0027309973793774 │ t
        404 │ 2020-08-01 16:13:00+00 │       1 │ 3.0027309973793774 │ t
        500 │ 2020-08-01 15:13:00+00 │       1 │ 3.0027309973793774 │ t
        500 │ 2020-08-01 15:11:00+00 │       1 │ 3.0027309973793774 │ t
        500 │ 2020-08-01 14:58:00+00 │       1 │ 3.0027309973793774 │ t
        400 │ 2020-08-01 14:56:00+00 │       1 │ 3.0027309973793774 │ t
        400 │ 2020-08-01 14:55:00+00 │       1 │ 3.3190952747131184 │ t
        400 │ 2020-08-01 14:50:00+00 │       1 │ 3.3190952747131184 │ t
        500 │ 2020-08-01 14:37:00+00 │       1 │ 3.0027309973793774 │ t
        400 │ 2020-08-01 14:35:00+00 │       1 │ 3.3190952747131184 │ t
        400 │ 2020-08-01 14:32:00+00 │       1 │ 3.3190952747131184 │ t
We decided to classify values with z-score greater than 3 as anomalies. 3 is usually the magic number you’ll see in textbooks, but don’t get sentimental about it because you can definitely change it to get better results.
Adding Thresholds
In the last query we detected a large number of "anomalies" with just one entry. This is very common in errors that don't happen very often. In our case, every once in a while we get a 400 status code, but because it doesn't happen very often, the standard deviation is very low so that even a single error can be considered way above the acceptable value.
We don't really want to receive an alert in the middle of the night just because of one 400 status code. We can't have every curious developer fiddling with the devtools in his browser wake us up in the middle of the night.
To eliminate rows with only a few entries we set a threshold:
WITH calculations_over_window AS (
   SELECT
       status_code,
       period,
       entries,
       AVG(entries) OVER status_window as mean_entries,
       STDDEV(entries) OVER status_window as stddev_entries
   FROM
       server_log_summary
   WINDOW status_window AS (
       PARTITION BY status_code
       ORDER BY period
       ROWS BETWEEN 60 PRECEDING AND CURRENT ROW
   )
),

with_zscore AS (
   SELECT
       *,
       (entries - mean_entries) / NULLIF(stddev_entries::float, 0) as zscore
   FROM
       calculations_over_window
),

with_alert AS (

   SELECT
       *,
       entries > 10 AND zscore > 3 AS alert
   FROM
       with_zscore
)

SELECT
   status_code,
   period,
   entries,
   zscore,
   alert
FROM
   with_alert
WHERE
   alert
ORDER BY
   period DESC;

status_code │         period         │ entries │       zscore       │ alert
────────────┼────────────────────────┼─────────┼────────────────────┼───────
        400 │ 2020-08-01 18:00:00+00 │      24 │  6.823777205473068 │ t
        400 │ 2020-08-01 17:59:00+00 │      12 │  7.445849602151508 │ t
        500 │ 2020-08-01 11:29:00+00 │    5001 │  3.172198441961645 │ t
        500 │ 2020-08-01 11:28:00+00 │    4812 │ 3.3971646910263917 │ t
        500 │ 2020-08-01 11:27:00+00 │    4443 │ 3.5349400089601586 │ t
        500 │ 2020-08-01 11:26:00+00 │    4522 │ 4.1264785335553595 │ t
        500 │ 2020-08-01 11:25:00+00 │    5567 │   6.17629336121081 │ t
        500 │ 2020-08-01 11:24:00+00 │    3657 │ 6.8689992361141154 │ t
        500 │ 2020-08-01 11:23:00+00 │    1512 │  6.342260662589681 │ t
        500 │ 2020-08-01 11:22:00+00 │    1022 │  7.682189672504754 │ t
        404 │ 2020-08-01 07:20:00+00 │      23 │  5.142126410098476 │ t
        404 │ 2020-08-01 07:19:00+00 │      20 │  6.091200697920824 │ t
        404 │ 2020-08-01 07:18:00+00 │      15 │   7.57547172423804 │ t
After eliminating potential anomalies with less than 10 entries we get much fewer, and probably more relevant results.
Eliminating Repeating Alerts
In the previous section we eliminated potential anomalies with less than 10 entries. Using thresholds we were able to remove some non interesting anomalies.
Let's have a look at the data for status code 400 after applying the threshold:
status_code │         period         │ entries │       zscore       │ alert
────────────┼────────────────────────┼─────────┼────────────────────┼───────
        400 │ 2020-08-01 18:00:00+00 │      24 │  6.823777205473068 │ t
        400 │ 2020-08-01 17:59:00+00 │      12 │  7.445849602151508 │ t
The first alert happened in 17:59, and a minute later the z-score was still high with a large number of entries and so we classified the next rows at 18:00 as an anomaly as well.
If you think of an alerting system, we want to send an alert only when an anomaly first happens. We don't want to send an alert every minute until the z-score comes back below the threshold. In this case, we only want to send one alert at 17:59. We don't want to send another alert a minute later at 18:00.
Let's remove alerts where the previous period was also classified as an alert:
WITH calculations_over_window AS (
   SELECT
       status_code,
       period,
       entries,
       AVG(entries) OVER status_window as mean_entries,
       STDDEV(entries) OVER status_window as stddev_entries
   FROM
       server_log_summary
   WINDOW status_window AS (
       PARTITION BY status_code
       ORDER BY period
       ROWS BETWEEN 60 PRECEDING AND CURRENT ROW
   )
),

with_zscore AS (
   SELECT
       *,
       (entries - mean_entries) / NULLIF(stddev_entries::float, 0) as zscore
   FROM
       calculations_over_window
),

with_alert AS (

   SELECT
       *,
       entries > 10 AND zscore > 3 AS alert
   FROM
       with_zscore
),

with_previous_alert AS (
   SELECT
       *,
       LAG(alert) OVER (PARTITION BY status_code ORDER BY period) AS previous_alert
   FROM
       with_alert
)

SELECT
   status_code,
   period,
   entries,
   zscore,
   alert
FROM
   with_previous_alert
WHERE
   alert AND NOT previous_alert
ORDER BY
   period DESC;

status_code │         period         │ entries │      zscore       │ alert
────────────┼────────────────────────┼─────────┼───────────────────┼───────
        400 │ 2020-08-01 17:59:00+00 │      12 │ 7.445849602151508 │ t
        500 │ 2020-08-01 11:22:00+00 │    1022 │ 7.682189672504754 │ t
        404 │ 2020-08-01 07:18:00+00 │      15 │  7.57547172423804 │ t
By eliminating alerts that were already triggered we get a very small list of anomalies that may have happened during the day. Looking at the results we can see what anomalies we would have discovered:
- Anomaly in status code 400 at 17:59: we also found that one earlier.
- Anomaly in status code 500: we spotted this one on the chart when we started.
- Anomaly in status code 404: this is a hidden hidden anomaly which we did not know about until now.
The query can now be used to fire alerts when it encounters an anomaly.
Experiment With Different Values
In the process so far we’ve used several constants in our calculations:
- Lookback period: How far back we calculate the mean and standard deviation for each status code. The value we used is 60 minutes.
- Entries Threshold: The least amount of entries we want to get an alert for. The value we used is 10.
- Z-Score Threshold: The z-score after which we classify the value as an anomaly. The value we used is 6.
Now that we have a working query to backtest, we can experiment with different values.

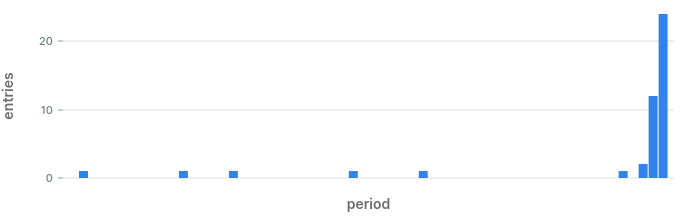
This is a chart showing the alerts our system identified in the past 12 hours:
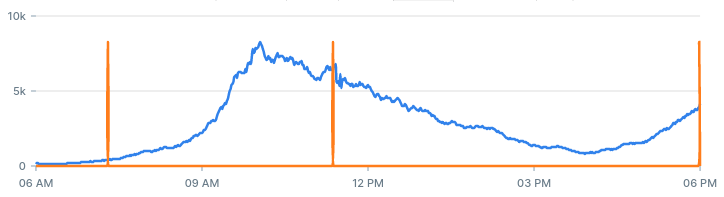
To get a sense of each parameter, let's adjust the values and see how it affects the number and quality of alerts we get.
If we decrease the value of the z-score threshold from 3 to 1, we should get more alerts. With a lower threshold, more values are likely to be considered an anomaly:
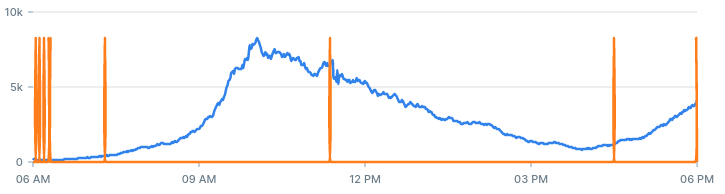
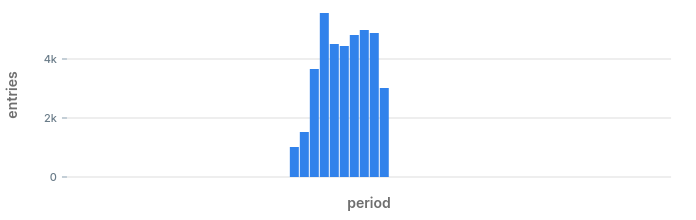
If we increase the entries threshold from 10 to 30, we should get less alerts:
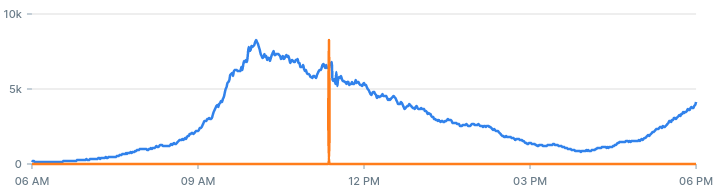
If we increase the backtest period from 60 minutes to 360 minutes, we get more alerts:
A good alerting system is a system that produces true alerts, at a reasonable time. Using the backtesting query you can experiment with different values that produces quality alerts you can act on.
Improving Accuracy
Using a z-score for detecting anomalies is an easy way to get started with anomaly detection and see results right away. But, this method is not always the best choice, and if you don't get good alerts using this method, there are some improvements and other methods you can try using just SQL.
Use Weighted Mean
Our system uses a mean to determine a reasonable value, and a lookback period to determine how long back to calculate that mean over. In our case, we calculated the mean based on data from 1 hour ago.
Using this method of calculating mean gives the same weight to entries that happened 1 hour ago and to entries that just happened. If you give more weight to recent entries at the expense of previous entries, the new weighted mean should become more sensitive to recent entries, and you may be able to identify anomalies quicker.
To give more weight to recent entries, you can use a weighted average:
SELECT
   status_code,
   avg(entries) as mean,
   sum(
      entries *
      (60 - extract('seconds' from '2020-08-01 17:00 UTC'::timestamptz - period))
   ) / (60 * 61 / 2) as weighted_mean
FROM
   server_log_summary
WHERE
   -- Last 60 periods
   period > '2020-08-01 17:00 UTC'::timestamptz
GROUP BY
   status_code;

 status_code │          mean          │    weighted_mean
─────────────┼────────────────────────┼─────────────────────
         404 │ 0.13333333333333333333 │ 0.26229508196721313
         500 │ 0.15000000000000000000 │ 0.29508196721311475
         200 │  2779.1000000000000000 │   5467.081967213115
         400 │ 0.73333333333333333333 │  1.4426229508196722
In the results you can see the difference between the mean and the weighted mean for each status code.
A weighted average is a very common indicator used by stock traders. We used a linear weighted average, but there are also exponential weighted averages and others you can try.
Use Median
In statistics, a mean is considered not robust because it is influenced by extreme values. Given our use case, the measure we are using to identify extreme values, is affected by those values we are trying to identify.
For example, in the beginning of the article we used this series of values:
2, 3, 5, 2, 3, 12, 5, 3, 4
The mean of this series is 4.33, and we detected 12 as an anomaly.
If the 12 were a 120, the mean of the series would have been 16.33. Hence, our "reasonable" value is heavily affected by the values it is supposed to identify.
A measure that is considered more robust is a median. The median of a series is the value that half the series is greater than, and half the series is less than:
SELECT percentile_disc(0.5) within group(order by n)
FROM unnest(ARRAY[2, 3, 5, 2, 3, 120, 5, 3, 4]) as n;

 median
────────
      3
To calculate the median in PostgreSQL we use the function percentile_disc. In the series above, the median is 3. If we sort the list and cut it in the middle it will become more clear:
2, 2, 3, 3, 3
4, 5, 5, 12
If we change the value of 12 to 120, the median will not be affected at all:
2, 2, 3, 3, 3
4, 5, 5, 120
This is why a median is considered more robust than mean.
Use MAD
Median absolute deviation (MAD) is another way of finding anomalies in a series. MAD is considered better than z-score for real life data.
MAD is calculated by finding the median of the deviations from the series median. Just for comparison, the standard deviation is the root square of the average square distance from the mean.
Use Different Measures
We used the number of entries per minute as an indicator. However, depending on the use case, there might be other things you can measure that can yield better results. For example:
- To try and identify DOS attacks you can monitor the ratio between unique IP addresses to HTTP requests.
- To reduce the amount of false positives, you can normalize the number of responses to the proportion of the total responses. This way, for example, if you're using a flaky remote service that fails once after every certain amount of requests, using the proportion may not trigger an alert when the increase in errors correlates with an increase in overall traffic.
Conclusion
The method presented above is a very simple method to detect anomalies and produce actionable alerts that can potentially save you a lot of grief. There are many tools out there that provide similar functionally, but they require either tight integration or $$$. The main appeal of this approach is that you can get started with tools you probably already have, some SQL and a scheduled task!
UPDATE: many readers asked me how I created the charts in this article... well, I used PopSQL. It’s a new modern SQL editor focused on collaborative editing. If you're in the market for one, go check it out...