I recently had the pleasure of optimizing an old dashboard. The solution we came up with required some advanced SQL that Django does not support out of the box. In this article I present the solution, how we got to it, and a word of caution.
advanced SQL
This article covers advanced topics in SQL aggregation. If you need to perform GROUP BY in Django ORM check out Understand Group by in Django with SQL.
The Dashboard
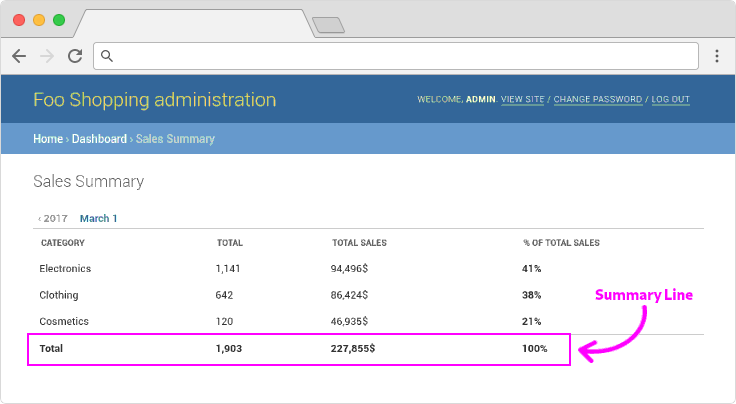
The dashboard is of a sales model. It includes a simple table with metrics grouped by merchants and their devices, and a summary line.
The code to produce the table looks roughly like this:
from django.db.models import Sum, Count, Avg, Q

metrics =  {
    'total': Count('id'),
    'avg_charged_amount': Avg('charged_amount'),
    'unique_users': Count('user', distinct=True),
}

results = (
    Sale.objects
    .values('merchant', 'device')
    .annotate(**metrics)
)
The code to produce the summary line uses the same metrics, and looks likes this:
summary = Sale.objects.annotate(**metrics)
Our admin gets a nice dashboard that looks roughly like this:
see also
On how to create the dashboard above see How to Turn Django Admin Into a Lightweight Dashboard
The Problem
The dashboard was working well for about three years. We got good response times and accurate information. However, as data piled up, performance has degraded to a point where the page became unusable.
To analyze the problem, we inspected the SQL, and timed it. The query to produce the table looks like this:
SELECT
    merchant,
    device,
    COUNT(id) AS total,
    AVG(charged_amount) AS avg_charged_amount,
    COUNT(DISTINCT user_id) AS unique_users
FROM
    sale
GROUP BY
    merchant,
    device
At worst, this query took about 30s to complete.
The next query executed by the dashboard was used to produce the summary line:
SELECT
    COUNT(id) AS total,
    AVG(charged_amount) AS avg_charged_amount,
    COUNT(DISTINCT user_id) AS unique_users
FROM
    sale
This query took roughly the same time, ~30s. Together, at their worst, the two queries took more than a minute to complete.
Aggregate in Memory
Both queries process the exact same data, the only difference is the GROUP BY key. The first query produces results at the merchant and device level, the second produces the same aggregates for the entire dataset.
The first thought that came to mind was to calculate the summary by aggregating the results in-memory.
The first metric, total, is easy to calculate:
summary_total = sum(r['total'] for r in results)
The second metric is the average charged amount. We can't just sum the average for each device and merchant, we need additional information.
To calculate the average charged amount for all merchants and devices, we need to divide the total charged amount by the number of sales. We already have the number of sales, so we need to add a metric for the total charged amount:
metrics =  {
    'total': Count('id'),
    'avg_charged_amount': Avg('charged_amount'),
    'total_charged_amount': Sum('charged_amount'),
    'unique_users': Count('user', distinct=True),
}
Now that we have both total and total_charged_amount, we can compute avg_charged_amount:
summary_total = sum(r['total'] for r in results)
summary_total_charged_amount = sum(r['total_charged_amount'] for r in results)
summary_avg_charged_amount = summary_total_charged_amount / summary_total
We have one metric left, unique_users. This metric counts the unique number of users that visited each device at each merchant. The same user can visit several devices at different merchants. If we sum unique_users we won't get the correct metric for the entire set.
It's impossible to accurately compute distinct values from aggregated results, so the solution must be in the database.
Aggregating in the Database
Most SQL implementations provide several useful functions to aggregate data at different levels.
Database Support
Throughout this article I use PostgreSQL. Similar functions are available in Oracle, MySQL and MSSQL. As far as I know, SQLite has no support for the functions I'm about to use.
Let's start with some data:
CREATE TABLE sale (
    id              integer,
    merchant        varchar,
    device          varchar,
    user_id         integer,
    charged_amount  integer,
    sold_at         timestamp
);

INSERT INTO sale
    (id, merchant,  device, user_id, charged_amount, sold_at)
VALUES
    (1,  'Walmart', 'D1',   1,       54,             NOW() + INTERVAL '1 days'),
    (2,  'Walmart', 'D1',   1,       100,            NOW() + INTERVAL '2 days'),
    (3,  'Walmart', 'D2',   1,       22,             NOW() + INTERVAL '1 days'),
    (4,  'Walmart', 'D2',   3,       14,             NOW() + INTERVAL '3 days'),
    (5,  'Walmart', 'D2',   4,       15,             NOW() + INTERVAL '4 days'),
    (6,  'Walmart', 'D3',   2,       29,             NOW() + INTERVAL '1 days'),
    (7,  'Walmart', 'D3',   2,       45,             NOW() + INTERVAL '3 days'),
    (8,  'Costco',  'D1',   1,       47,             NOW() + INTERVAL '5 days'),
    (9,  'Costco',  'D1',   4,       223,            NOW() + INTERVAL '1 days'),
    (10, 'Costco',  'D1',   5,       67,             NOW() + INTERVAL '2 days'),
    (11, 'Costco',  'D4',   1,       25,             NOW() + INTERVAL '5 days'),
    (12, 'Costco',  'D5',   3,       125,            NOW() + INTERVAL '4 days'),
    (13, 'Costco',  'D5',   4,       150,            NOW() + INTERVAL '1 days');
The query we used in our dashboard produces the following results:
db=# SELECT
    merchant,
    device,
    COUNT(id) AS total,
    AVG(charged_amount) AS avg_charged_amount,
    COUNT(DISTINCT user_id) AS unique_users
FROM
    sale
GROUP BY
    merchant,
    device;

 merchant | device | total |  avg_charged_amount  | unique_users
----------+--------+-------+----------------------+--------------
 Costco   | D1     |     3 | 112.3333333333333333 |            3
 Costco   | D4     |     1 |  25.0000000000000000 |            1
 Costco   | D5     |     2 | 137.5000000000000000 |            2
 Walmart  | D1     |     2 |  77.0000000000000000 |            1
 Walmart  | D2     |     3 |  17.0000000000000000 |            3
 Walmart  | D3     |     2 |  37.0000000000000000 |            1
(6 rows)
The query to produce the summary line:
db=# SELECT
    COUNT(id) AS total,
    AVG(charged_amount) AS avg_charged_amount,
    COUNT(DISTINCT user_id) AS unique_users
FROM
    sale;

 total | avg_charged_amount  | unique_users
-------+---------------------+--------------
    13 | 70.4615384615384615 |            5
(1 row)
Rollup
The first special GROUP BY expression is ROLLUP. As the name suggest, ROLLUP aggregate at the lowest level and up:
db=# SELECT
    device,
    merchant,
    COUNT(*)
FROM
    sale
GROUP BY
    ROLLUP(device, merchant);

 device | merchant | count
--------+----------+-------
        |          |    13
 D3     | Walmart  |     2
 D5     | Costco   |     2
 D1     | Walmart  |     2
 D4     | Costco   |     1
 D1     | Costco   |     3
 D2     | Walmart  |     3
 D2     |          |     3
 D4     |          |     1
 D1     |          |     5
 D5     |          |     2
 D3     |          |     2
(12 rows)
We grouped by two fields, device and merchant, and we got three groups of aggregation:
()all(device, merchant)(device)
ROLLUP aggregates "up", so the order of the fields is significant. Let's flip the order of the fields:
db=# SELECT
    device,
    merchant,
    count(*)
FROM
    sale
GROUP BY
    ROLLUP(merchant, device);

 device | merchant | count
--------+----------+-------
        |          |    13
 D4     | Costco   |     1
 D3     | Walmart  |     2
 D1     | Walmart  |     2
 D1     | Costco   |     3
 D5     | Costco   |     2
 D2     | Walmart  |     3
        | Costco   |     6
        | Walmart  |     7
This time we got the following groups:
()all(merchant, device)(merchant)
Cube
The next group by expression is most likely borrowed from OLAP, which often mention cubes. The CUBE expression aggregates all possible combinations:
db=# SELECT
    device,
    merchant,
    count(*)
FROM
    sale
GROUP BY
    CUBE(merchant, device);

 device | merchant | count
--------+----------+-------
        |          |    13
 D4     | Costco   |     1
 D3     | Walmart  |     2
 D1     | Walmart  |     2
 D1     | Costco   |     3
 D5     | Costco   |     2
 D2     | Walmart  |     3
        | Costco   |     6
        | Walmart  |     7
 D2     |          |     3
 D4     |          |     1
 D1     |          |     5
 D5     |          |     2
 D3     |          |     2
(14 rows)
The results contain the following groups:
()all(device, merchant)(merchant)(device)
Grouping Sets
Grouping sets allows us to provide the exact groups of aggregation we want. For example, to recreate the results of the ROLLUP above, we can provide the following grouping sets:
db=# SELECT
    device,
    merchant,
    count(*)
FROM
    sale
GROUP BY
    GROUPING SETS (
        (merchant),
        (merchant, device),
        ()
    )

 device | merchant | count
--------+----------+-------
        |          |    13
 D4     | Costco   |     1
 D3     | Walmart  |     2
 D1     | Walmart  |     2
 D1     | Costco   |     3
 D5     | Costco   |     2
 D2     | Walmart  |     3
        | Costco   |     6
        | Walmart  |     7
(9 rows)
Each list of fields inside parentheses in the GROUPING SETS is a group in the result.
Both CUBE and ROLLUP can be implemented using GROUPING SETS. The following table shows the equivalent GROUPING SETS expression for both ROLLUP and CUBE, on two fields a and b:
| expression | equivalent grouping sets |
|---|---|
ROLLUP(a, b) |
GROUPING SETS ((a, b), (a), ()) |
CUBE(a, b) |
GROUPING SETS ((a, b), (a), (b) ()) |
In our original query we had metrics at the merchant and device level, and we wanted to get a summary line. Using GROUPING SETS, this query will look like this:
db=# SELECT
    merchant,
    device,
    COUNT(id) AS total,
    AVG(charged_amount) AS avg_charged_amount,
    COUNT(DISTINCT user_id) AS unique_users
FROM
    sale
GROUP BY
    GROUPING SETS (
        (merchant, device),
        ()
    )

 merchant | device | total |  avg_charged_amount  | unique_users
----------+--------+-------+----------------------+--------------
 Costco   | D1     |     3 | 112.3333333333333333 |            3
 Costco   | D4     |     1 |  25.0000000000000000 |            1
 Costco   | D5     |     2 | 137.5000000000000000 |            2
 Walmart  | D1     |     2 |  77.0000000000000000 |            1
 Walmart  | D2     |     3 |  17.0000000000000000 |            3
 Walmart  | D3     |     2 |  37.0000000000000000 |            1
          |        |    13 |  70.4615384615384615 |            5
(7 rows)
The first 6 lines are similar to the original query. The last line is similar to the results from the summary query we used.
Using GROUPING SETS we get the results we need in just one query instead of two.
Using Grouping Sets in Django
Now that we have the query, we need to find a way to use it with Django. Unfortunately, Django still has no support for grouping sets. On top of that, the query is generated by Django Admin, and it includes predicates from list filters and date hierarchy. We couldn't just use raw SQL.
We need to find a way to modify a given Django QuerySet, and add grouping sets to it.
Since Django has no built-in support for grouping sets, we are forced to manipulate the query. The base query we need to manipulate is the query that Django generates, along with any predicates and annotations added by Django Admin. Eventually, we want to execute the query in the database the same way Django does.
Getting the Query
A nice feature of Django QuerySet is that it provides the generated SQL:
>>> qs = (
>>> ... Sale.objects
>>> ... .values('merchant', 'device')
>>> ... .annotate(**metrics)
>>> )
>>> print(qs.query)
SELECT "sale"."merchant", "sale"."device", COUNT("sale"."id") AS "total",
AVG("sale"."charged_amount") AS "avg_charged_amount",
COUNT(DISTINCT "sale"."user_id") AS "unique_users" FROM "sale"
GROUP BY "sale"."merchant", "sale"."device"
This is a simple query, can we execute it directly in the database?
>>> from django.db import connection
>>>
>>> with connection.cursor() as cursor:
>>> ... cursor.execute(str(qs.query))
>>> ... results = cursor.fetchall()
>>> results
[('Costco', 'D1', 3, 112.3333333333333333, 3),
('Costco', 'D4', 1, 25.0000000000000000, 1),
...
('Walmart', 'D3', 2, 37.0000000000000000, 1)]
This looks like something we can work with, let's dig deeper...
As mentioned before, the QuerySet is generated by Django Admin, and it might include predicates for list filters and date hierarchy. Let's try to execute a query with a predicate on the sold_at date field:
>>> import datetime
>>> from django.db import connection
>>> from django.utils import timezone
>>>
>>> qs = qs.filter(sold_at__lt=timezone.now())
>>> with connection.cursor() as cursor:
>>> ... cursor.execute(str(qs.query))
*** django.db.utils.ProgrammingError: syntax error at or near "00"
LINE 1: ..."sale"."sold_at" >= 2019-03-02 00:00:00+0...
Looks like Django is unable to execute the query as is. The reason for that is that the text generated by str(qs.query) is just a text representation of the query. Under the hood, Django uses proper bind variables (might also be known as substitution variables) to avoid SQL injection.
Much of the Django ORM QuerySet logic is carried out by an internal class called Query. The class is not documented. The only place to learn about it is in the source. One promising function of Query is sql_with_params. Let's use it on the query above, and see what we get:
>>> qs = qs.filter(sold_at__lt=timezone.now())
>>> sql, params = qs.query.sql_with_params()
>>> sql
SELECT "sale"."merchant", "sale"."device", COUNT("sale"."id") AS "total",
AVG("sale"."charged_amount") AS "avg_charged_amount",
COUNT(DISTINCT "sale"."user_id") AS "unique_users" FROM "sale"
WHERE "sale"."sold_at" < %s
GROUP BY "sale"."merchant", "sale"."device" ORDER BY "sale"."merchant", "sale"."device"
>>> params
(datetime.datetime(2019, 3, 2, 0, 0, tzinfo=<UTC>))
The function sql_with_params returns a tuple. The first argument is the SQL query. The second, is a list of parameters to that query.
The keen-eyed might have spotted the placeholder %s in the query text:
WHERE "sale"."sold_at" < %s
This placeholder corresponds to the parameter we got in the second argument. Let's try to execute the query with the placeholder, and the params:
>>> import datetime
>>> from django.db import connection
>>> from django.utils import timezone
>>>
>>> qs = qs.filter(sold_at__lt=timezone.now())
>>> sql, params = qs.query.sql_with_params()
>>>
>>> with connection.cursor() as cursor:
>>> ... cursor.execute(sql, params)
>>> ... results = cursor.fetchall()
>>> results
[('Costco', 'D1', 3, 112.3333333333333333, 3),
('Costco', 'D4', 1, 25.0000000000000000, 1),
...
('Walmart', 'D3', 2, 37.0000000000000000, 1)]
Great! We are now able to execute a query as Django does. We are ready to manipulate the query.
Manipulating the Query
The query generated by Django includes a simple GROUP BY clause:
GROUP BY "sale"."merchant", "sale"."device" ORDER BY "sale"."merchant", "sale"."device"
We want to replace that with the following group by clause:
GROUP BY GROUPING SETS (("sale"."merchant", "sale"."device"), ()) ORDER BY "sale"."merchant", "sale"."device"
This looks like a job for re.
We want catch the grouped by fields between GROUP BY and ORDER BY, and make them the first group in the GROUPING SET expression. Then, we want add the group () for the summary:
import re

sql_with_grouping_sets = re.sub(
    r'GROUP BY (.*) ORDER',
    r'GROUP BY GROUPING SETS (( \1 ), ()) ORDER',
    sql,
)
Now we can take the modified query, and execute it with the params:
>>> with connection.cursor() as cursor:
>>> ... cursor.execute(sql_with_grouping_sets, params)
>>> ... results = cursor.fetchall()
>>> results
[('Costco', 'D1', 3, 112.3333333333333333, 3),
('Costco', 'D4', 1, 25.0000000000000000, 1),
...
('Walmart', 'D3', 2, 37.0000000000000000, 1)]
(None, None, 13, 70.4615384615384615, 5)]
Lo and behold... We got both the results and the summary line in a single query.
Conclusion
Several important issues to consider about this approach:
-
Don't do this!: This is as bad as it gets. This approach is a nice exercise, and a great opportunity to explore the ORM internals, but the implementation is too fragile. When using an internal, undocumented API, there is no guaranty it wont change unexpectedly in the future. Having said that, we decided to use this approach in one of our internal admin pages. It's a very specific scenario involving a queryset that's not used for any user facing features. It helped us cut the page response time exactly in half and we are pleased with the result.
-
Make the sort order deterministic: When using
GROUPING SETS(andROLLUPorCUBEfor that matter), you mix more than one level of aggregation in a single query. To be able to fetch the results in a predictable way, it's important to explicitly sort the results. For example, in the query above, to make sure the summary row is the first row, add the following sort orderqs.order_by( F('merchant').desc(nulls_last=False) ).